




Forget the stock ticker for a second. The number actually moving markets right now is the US 10-year Treasury yield, and it just touched 5.34%, a level nobody’s seen since 2002, higher even than where it sat right before the 2008 crash.
On its own, 5.3% isn’t a crisis. What it is, is a signal. The cost of money globally has shifted into a different gear than the one most portfolios were actually built for.
Why 5.3% actually matters
Everyone wants to argue about whether yields keep climbing from here. That’s the less interesting question. The one that actually matters is why they’re rising in the first place, because the answer changes what you should do about it.
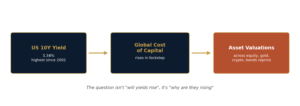
US 10Y yield feeds into the global cost of capital, which reprices assets across the board
A few things are genuinely driving this. Heavy bond issuance, both Treasury and corporate, is fighting over the same pool of investor money, and that’s pushing up the term premium, basically the extra reward investors want for locking cash away long-term instead of just rolling over short-term bills. Add in the sheer scale of capital spending from AI companies and everyone supplying them, all of it financed with more bond issuance, into a market that was already stretched. Throw sticky inflation on top, refusing to cooperate the way the Fed would like, and you’ve got a genuine traffic jam.
Once yields sit at 5.5 to 6%, the whole market has to swallow much higher financing costs, everywhere, not just in bonds. That’s the actual test running right now.
What history actually tells us about yields this level
Here’s something worth sitting with for a second: the exact same yield level has played out completely differently depending on what else was going on in the economy at the time.
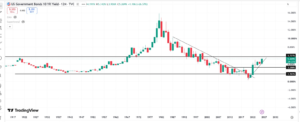
US 10-Year Treasury yield, monthly, 1917 to present
Look at that chart and the shape tells its own story. The Volcker-era spike above 15% in the early 1980s, the long, slow grind down to near-zero after the financial crisis, and now the sharp snap back up over the last few years. Today’s 5.3% sits right back at a level the market hasn’t visited since 2002.
1981 had yields above 15%, Volcker fighting inflation head-on, a brutal recession, and yields that eventually collapsed once inflation finally broke. 1994 saw yields near 8% during an aggressive tightening cycle, and that alone was enough to shock the bond market badly, no crisis required, just the speed of the move.
Then came 2000, where 6 to 7% was all it took to pop the dot-com bubble, and the longest-duration growth names took the worst of it. 2007’s the one that should make people nervous, yields were sitting around 5%, basically where we are now, looking calm on the surface while leverage quietly piled up underneath. The yield wasn’t the problem that year. The leverage nobody could see was. And then 2022 came along with yields barely at 4 to 5%, nowhere near today’s level, and it still wrecked equities, bonds, and crypto all in the same stretch, because it wasn’t really about the level at all. It was about how fast rates moved.
Five completely different setups, and somehow the same lesson keeps showing up: the yield number alone doesn’t tell you much of anything. What actually decides how bad things get is the regime sitting underneath that number, and specifically, how much leverage has quietly built up by the time the shock lands.
What 5.3 to 6% actually means for different assets
Direction matters, sure. What’s actually driving the move matters more, and every asset class reacts to that driver in its own way.
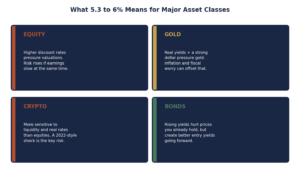
Equity faces valuation pressure, gold faces a real-yield headwind, crypto is liquidity-sensitive, bonds get better entry points as prices fall
Equities take the hit first, and they take it directly. Higher discount rates squeeze valuations, and the growth names everyone loved a year ago, the ones priced for a decade out, feel it worst. The real trouble isn’t any one of these things happening alone. It’s yields climbing, earnings slowing down, and credit spreads widening all at the same moment. That’s the combination that actually hurts.
Gold’s stuck in a genuine tug of war. Higher real yields and a stronger dollar usually weigh on it. But inflation worry, geopolitical tension, and fiscal anxiety about government debt can offset that, sometimes completely, which is exactly why gold hasn’t followed the simple “yields up, gold down” script this cycle.
Crypto cares more about liquidity and real rates than it does about traditional risk sentiment. The real worry isn’t the level of yields, it’s a sudden 2022-style shock where things move too fast for anyone to adjust.
Bonds get hit hardest on what you already own, rising yields mean falling prices on existing holdings, no way around that. But new money deployed today gets a genuinely better forward yield than it would have a year ago. The opportunity actually improves from here if yields eventually come back down.
Worth remembering through all of this: 5.5% alongside strong corporate earnings and 5.5% alongside recession fear look identical on a yield chart and are not the same environment at all.
Three scenarios from here, and why nailing the exact top doesn’t matter
Nobody needs to nail the exact peak in yields to make sensible calls here. What actually matters is figuring out which of these regimes you’re actually in.
One path: growth holds up and yields settle somewhere around 5.5%. GDP’s fine, earnings are fine, inflation’s cooling off gradually. In that world equities mostly shrug it off, gold stays choppy without going anywhere decisive, crypto just follows wherever liquidity goes, and bonds wobble for a bit before they settle down.
Or inflation stays sticky and yields sit in the 5.5 to 6% zone. Oil and inflation both stay elevated, the Fed stays restrictive longer than anyone currently expects, and that’s a rougher setup, equity valuations take real pressure, gold potentially does better if inflation and fiscal worry dominate the story, crypto struggles, and bonds stay weak the whole way through.
Or yields push toward 6% because the economy’s actually slowing. Growth and inflation both fall, the Fed starts signaling easing, and long bonds become the quiet winner here, equities wobble first before a possible recovery setup builds, gold turns defensive, and crypto stays vulnerable, at least in the early stretch.
What actually splits these three paths apart isn’t the 10-year yield sitting there in isolation. It’s that number read alongside the real yield, credit spreads, and where inflation’s actually heading, watched together, never just one number on its own.
Why Indian investors should genuinely care about a US number
A lot of Indian investors glance at this and assume it’s someone else’s problem, a US story that stays in the US. It doesn’t. The chain connecting it to your own portfolio is remarkably short and direct.
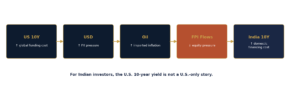
The US yield shock transmits through the dollar, oil, FPI flows, and into India’s own 10-year yield
A rising US 10-year pushes up what it costs to borrow money globally, which strengthens the dollar and leans on the rupee. A weaker rupee makes oil cost more to import, and that feeds straight into domestic inflation. That combination usually sends FPI money out of Indian equities, because foreign investors can chase better risk-adjusted returns somewhere else entirely. All of it together pushes India’s own 10-year yield up too, along with domestic borrowing costs.
This isn’t some theoretical chain either. As of early October 2026, the rupee’s been sitting close to ₹96 to the dollar, its weakest stretch in months, and persistent FPI outflows plus elevated oil prices are the exact drivers being cited, which is precisely what this transmission chain predicts. India’s forex reserves and recent trade agreements have cushioned some of it, but the underlying pressure from global yields is real and it isn’t going away on its own.
Bottom line for Indian portfolios: the US 10-year yield isn’t a US-only story. It shows up in your currency, your import bill, your equity flows, and eventually, what it costs you to borrow.
A framework for watching this, not reacting to it
None of this is about predicting the next tick in yields. It’s about reading the regime correctly, because what you should actually do genuinely depends on which of those three scenarios is actually playing out.
Keep an eye on the 10-year Treasury itself, sitting right now in that 5.3% stress zone. Watch the 10-year real yield too, it matters a lot for how gold and anything long-duration actually behaves. Track where inflation’s actually heading, sticky inflation usually means rates stay higher for longer than the market currently wants to believe. Watch credit spreads as your early warning system, once they start widening, that’s financial stress showing up before it hits the headlines. And if you’re managing an Indian portfolio, keep USD/INR close, it’s the hinge point between what happens in Washington and what shows up in your own account.
5.3% isn’t really the story. The reason behind 5.3% is the story. Watch the yield, figure out why it’s actually moving, and only then decide what to do, instead of reacting to a headline number sitting there by itself.
If a shift like this has you second-guessing how your money’s positioned, that’s worth figuring out now, while the move’s still playing out, not after it’s already happened. The Fair Advice puts investors in touch with verified, unbiased financial advisors, and structured, principal-protected products built for exactly this kind of moment, where actually understanding what’s happening beats guessing at whatever headline comes next.
The one-line investment message
“The 10-Year Treasury at 5.3% is not necessarily a crisis. It is a signal that the global cost of capital has entered a different regime.”
For investors, that means the answer isn’t to abandon one asset class and jump into another. It’s to understand which economic regime is taking shape, and position portfolios for it.
Watch the yield.
Understand the reason.
Then allocate.
THE FAIR ADVICE
Where Better Decisions Create Better Profit
This piece is meant for general information, not as financial, investment, tax, or legal advice. Markets move fast, yields and currency levels included, and everything cited here reflects where things stood in early October 2026. Check with a qualified financial advisor before acting on any of it. Sources: Reuters, Federal Reserve/FRED, CNBC, Trading Economics.